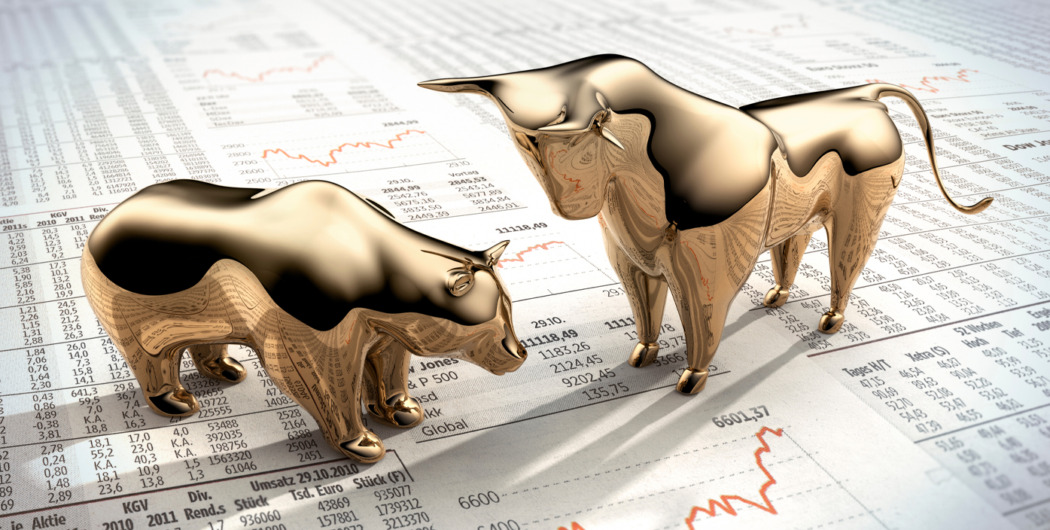

Bulls and bears are metaphors for the movement of a market. If you’ve seen photos of the New York Financial District, you may have seen the most iconic representation of the market sentiment.

Wall Street’s famous “Charging Bull” was installed by Arturo Di Modica without permission on the night of December 16, 1989. This 3.5-ton bronze beast reportedly cost the artist $350,000 of his own funds. The symbol of resilience has seen been recreated in Germany, Bulgaria, India, Pakistan, and the Netherlands.
If you’ve always wondered what bulls and bears mean in the trading community, there is actually a simple answer.
Characteristics of bulls and bears
A bull is a stock market speculator who buys stock expecting its value to grow in the short term and in the long term. A bear is the opposite — these traders sell their shares, often out of fear that the stock or the wider market will crash. But these are not always different people — you can be a bull or a bear at different points throughout your trading journey. In fact, you can even be a bull in one market and a bear in another one.
The terms “bull” and “bear” are often used to describe market cycles (you may also come across the term “bullish” and “bearish: in similar contexts):
- A bull market begins when market participants become confident that the prices will start rising. It often becomes a self-fulfilling prophecy where investors drive prices upward by buying and holding.
- A bear market begins when the confidence in rising prices collapses. Bears start selling their assets, creating a downward spiral in the market. Bear markets are usually more short-lived.

Examples
Some of the longest bull markets in recent history were:
- 1949 to 1956 (86 months), when the Dow Industrials gained around 230%
- 1982 to 1987 (60 months), when the S&P 500 generated average annual returns of nearly 27%
- 1990 to 2000 (113 months), when the market grew by more than 300% during the roaring 90s
- 2009 to 2020 (131 months), when the S&P 500 surged more than 400%
And here are the bears that lead to some of the biggest recessions in the last 25 years:
- From March 2000 to September 2001 (a bust in the dot-com industry), the market went down more than 36%
- From October 2007 to November 2008 (collapse of the housing market) — a sharp drop of nearly 52%
- February 2020 to March 2020 (the COVID pandemic) — a 34% drop
Where did bulls and bears come from?

Bulls and bears are both animals known for their incredible and unpredictable strength, so these images illustrate market volatility quite well. The exact origins of these expressions in the trading contexts are unclear. But there are two common explanations:
- Bulls attract their opponents by thrusting their horns up into the air, which is a metaphor for an upward movement. Bears stamp their paws down on their prey — hence, the downward movement.
- A long time ago, sellers would sell bearskins they had yet to receive and speculate that the price would go down. Thus, they would pocket the difference between the cost price and the selling price. They were nicknamed bears.

Bull vs. bear markets: What to do in each case
The ideal scenario in the bull market is taking advantage of higher prices and selling assets at their peaks. With that said, you should also adopt a phased approach to selling. This way, you may not always catch the top, but each following exit can be made at a better price.
When bear markets hit, get rid of stocks without clear, durable competitive advantages. If you think the stock will eventually recover, you can invest in more equity at a lower cost.
How to understand if the market is bullish or bearish
Bullish markets usually coincide with periods of significant economic expansion and growth. This is when investor confidence appears to be rising, employment levels are high, and economic development is strong.
If the market is in the bearish phase, key economic signals — hiring, wage growth, inflation, and interest rates — are slowing. When investors see a shrinking economy, they can begin panic selling, which brings the prices even lower.The easiest way to tell when the market is already bullish or bearish is by looking at asset charts. But if you want to guess when the market will turn bullish or bearish, use technical and fundamental analytical tools.
***
Of course, bulls and bears are not the only terms traders use in the market. Want to learn more? Check out a new video and see who you are: a bull, a bear, or maybe a wolf?
Tony is a financial analyst of the Binomo team. He is a trader with many years of experience in the market. Tony is the face of our YouTube and Instagram channels and is doing everything to help traders achieve new heights.


